
Fix and Flip in Middle Tennessee: Five County Markets Compared
Fix and flip in Middle Tennessee looks different county to county. Census home values and housing ages plus October listing data across five counties.
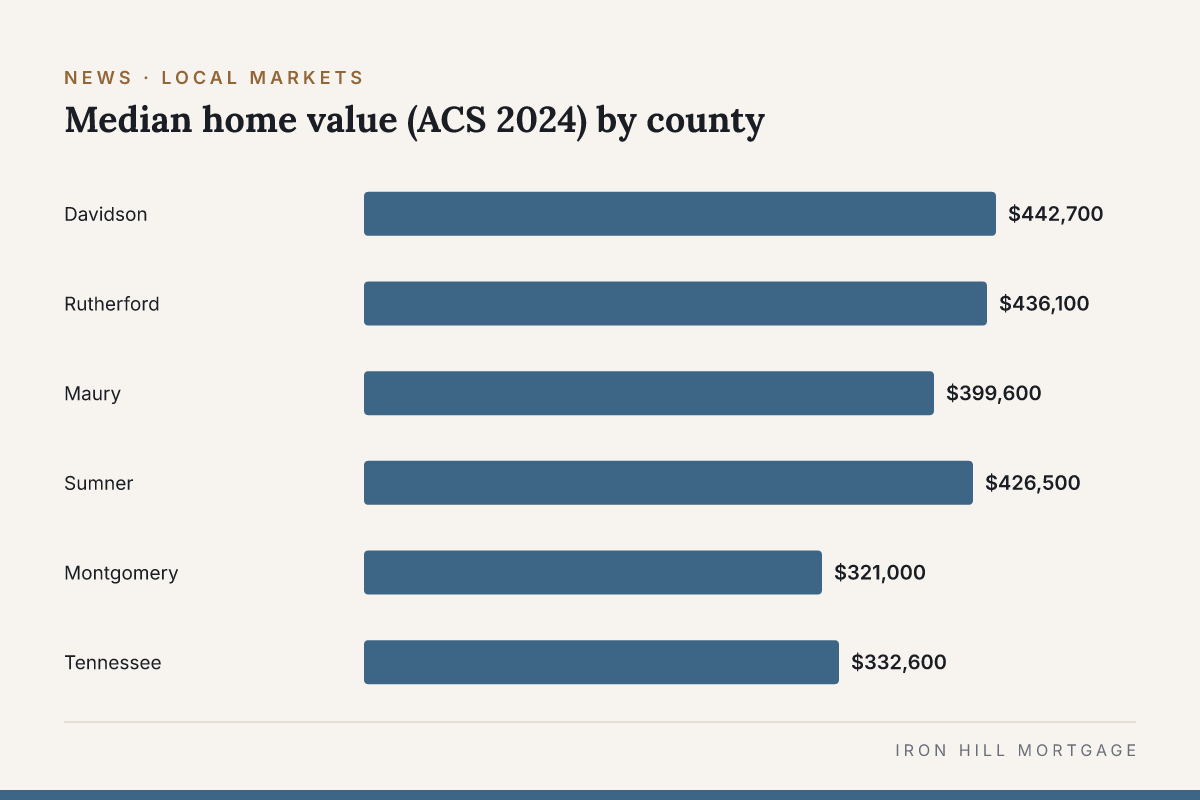
Franklin, Tenn. — November 20, 2026 — Investors weighing a fix and flip in Middle Tennessee are working with five county markets that differ in home values, in the age of their housing and in how long listings are taking to sell. Census Bureau survey data and Realtor.com's October 2026 listing figures show those differences side by side for Davidson, Rutherford, Maury, Sumner and Montgomery counties.
The figures describe each county as a whole. They are not a ranking of where flips work, and any single deal turns on the property, the purchase price and the after-repair value.
Fix and flip in Middle Tennessee: how the five counties compare
| County | Median home value (ACS 2024) | Median year built (ACS 2024) | Median listing price (Oct. 2026) | Median days on market (Oct. 2026) |
|---|---|---|---|---|
| Davidson | $442,700 | 1988 | $525,000 | 68 |
| Rutherford | $436,100 | 2002 | $474,900 | 59 |
| Maury | $399,600 | 1998 | $489,900 | 58 |
| Sumner | $426,500 | 1996 | $477,000 | 61 |
| Montgomery | $321,000 | 2000 | $349,900 | 70 |
| Tennessee | $332,600 | 1988 | — | — |
Home values and year built are from the U.S. Census Bureau's American Community Survey 2024 1-year estimates (tables B25077 and B25035); listing prices and days on market are from Realtor.com's county inventory data for October 2026. ACS figures are survey estimates with margins of error; median home value is the owner's estimate for owner-occupied homes.
Where is the older housing stock?
Housing age is one rough guide to how much renovation work a market holds. Davidson County's median year built, 1988, matches the statewide median and is the oldest of the five. Rutherford's 2002 median is the newest. Maury, Sumner and Montgomery fall in between, from 1996 to 2000.
An older median does not mean a given house needs work, and a newer one does not rule it out. It does mean the share of homes old enough for roofs, systems and kitchens to be due for replacement is larger in some counties than others. The Iron Hill Brief covered the national side of that trend in its report on how short-term investor lending helps rehab aging stock.
How long are listings taking to sell?
Days on market matter to a flip because each month a finished house sits adds to carrying costs. In Realtor.com's October 2026 data, the median listing in the five counties spent 58 to 70 days on the market. Montgomery, at 70 days, and Davidson, at 68, were the longest. Days on market were up from a year earlier in Sumner (16.2%), Montgomery (13.8%), Rutherford (4.4%) and Davidson (3.0%), and down 2.5% in Maury.
Median listing prices ran above the Census median home values in every county. The two measures are not directly comparable: one is the asking price of homes for sale in October, the other is what owners estimated their homes were worth in 2024.
For how lenders size a flip loan against purchase price, rehab and after-repair value, see the Brief's guide to fix-and-flip loans in Tennessee. Iron Hill's fix-and-flip loans page outlines the product.
Working on a Tennessee rental? Talk with an Iron Hill loan advisor: text Ashley at 615-949-4780 or book a time here. Iron Hill Mortgage | NMLS #1946451.
Business-purpose loans for investment property only. Not for personal, family or household use. Subject to approval. Equal Housing Opportunity.
Sources
- U.S. Census Bureau, American Community Survey 2024 1-year estimates, tables B25077 (median value) and B25035 (median year structure built), via Census Reporter (accessed Nov. 19, 2026): https://censusreporter.org/data/table/?table=B25035&geo_ids=05000US47037,05000US47149,05000US47119,05000US47165,05000US47125,04000US47
- Realtor.com Economic Research, Residential Data, Inventory Core Metrics by County, October 2026 (accessed Nov. 19, 2026): https://www.realtor.com/research/data/